research
- A joint research team in computer science, economics, and geography has developed an artificial intelligence (AI) technology to measure grid-level economic development within six-square-kilometer regions.
- This AI technology is applicable in regions with limited statistical data (e.g., North Korea), supporting international efforts to propose policies for economic growth and poverty reduction in underdeveloped countries.
- The research team plans to make this technology freely available for use to contribute to the United Nations' Sustainable Development Goals (SDGs).
The United Nations reports that more than 700 million people are in extreme poverty, earning less than two dollars a day. However, an accurate assessment of poverty remains a global challenge. For example, 53 countries have not conducted agricultural surveys in the past 15 years, and 17 countries have not published a population census. To fill this data gap, new technologies are being explored to estimate poverty using alternative sources such as street views, aerial photos, and satellite images.
The paper published in Nature Communications demonstrates how artificial intelligence (AI) can help analyze economic conditions from daytime satellite imagery. This new technology can even apply to the least developed countries - such as North Korea - that do not have reliable statistical data for typical machine learning training.
The researchers used Sentinel-2 satellite images from the European Space Agency (ESA) that are publicly available. They split these images into small six-square-kilometer grids. At this zoom level, visual information such as buildings, roads, and greenery can be used to quantify economic indicators. As a result, the team obtained the first ever fine-grained economic map of regions like North Korea. The same algorithm was applied to other underdeveloped countries in Asia: North Korea, Nepal, Laos, Myanmar, Bangladesh, and Cambodia (see Image 1).
The key feature of their research model is the "human-machine collaborative approach," which lets researchers combine human input with AI predictions for areas with scarce data. In this research, ten human experts compared satellite images and judged the economic conditions in the area, with the AI learning from this human data and giving economic scores to each image. The results showed that the Human-AI collaborative approach outperformed machine-only learning algorithms.
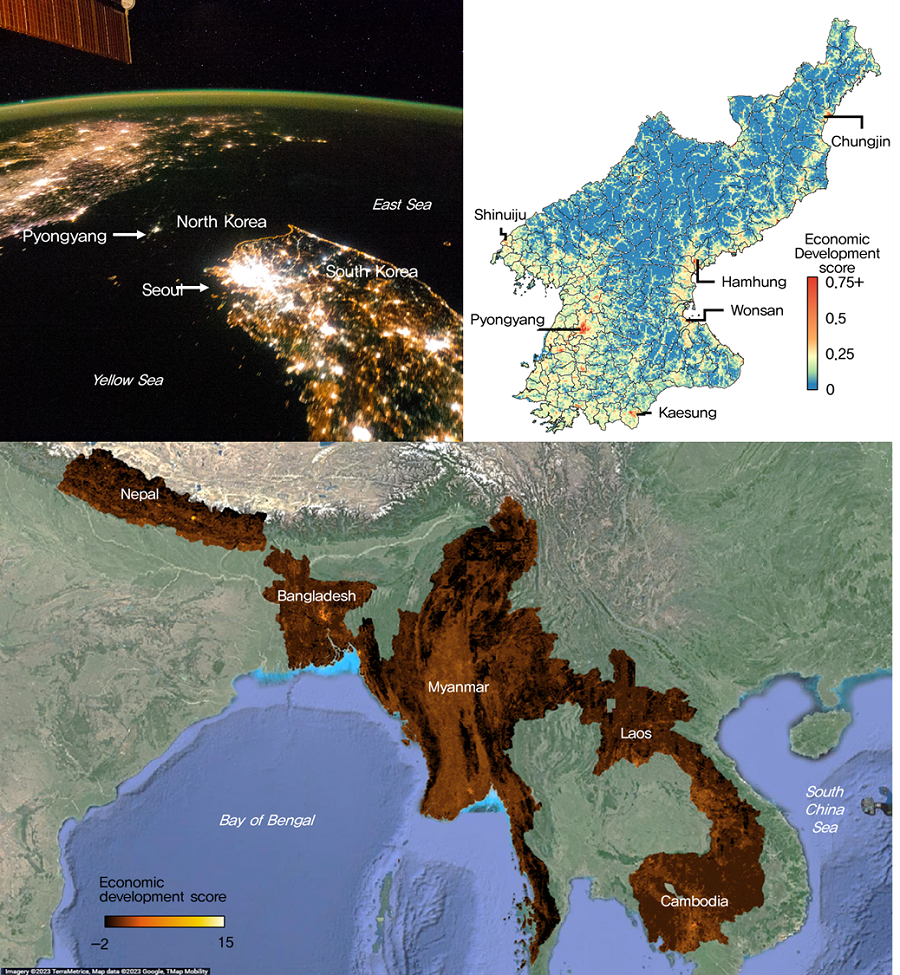
< Image 1. Nightlight satellite images of North Korea (Top-left: Background photo provided by NASA's Earth Observatory). South Korea appears brightly lit compared to North Korea, which is mostly dark except for Pyongyang. In contrast, the model developed by the research team uses daytime satellite imagery to predict more detailed economic predictions for North Korea (top-right) and five Asian countries (Bottom: Background photo from Google Earth). >
The research was led by an interdisciplinary team of computer scientists, economists, and a geographer from KAIST & IBS (Donghyun Ahn, Meeyoung Cha, Jihee Kim), Sogang University (Hyunjoo Yang), HKUST (Sangyoon Park), and NUS (Jeasurk Yang). Dr Charles Axelsson, Associate Editor at Nature Communications, handled this paper during the peer review process at the journal.
The research team found that the scores showed a strong correlation with traditional socio-economic metrics such as population density, employment, and number of businesses. This demonstrates the wide applicability and scalability of the approach, particularly in data-scarce countries. Furthermore, the model's strength lies in its ability to detect annual changes in economic conditions at a more detailed geospatial level without using any survey data (see Image 2).

< Image 2. Differences in satellite imagery and economic scores in North Korea between 2016 and 2019. Significant development was found in the Wonsan Kalma area (top), one of the tourist development zones, but no changes were observed in the Wiwon Industrial Development Zone (bottom). (Background photo: Sentinel-2 satellite imagery provided by the European Space Agency (ESA)). >
This model would be especially valuable for rapidly monitoring the progress of Sustainable Development Goals such as reducing poverty and promoting more equitable and sustainable growth on an international scale. The model can also be adapted to measure various social and environmental indicators. For example, it can be trained to identify regions with high vulnerability to climate change and disasters to provide timely guidance on disaster relief efforts.
As an example, the researchers explored how North Korea changed before and after the United Nations sanctions against the country. By applying the model to satellite images of North Korea both in 2016 and in 2019, the researchers discovered three key trends in the country's economic development between 2016 and 2019. First, economic growth in North Korea became more concentrated in Pyongyang and major cities, exacerbating the urban-rural divide. Second, satellite imagery revealed significant changes in areas designated for tourism and economic development, such as new building construction and other meaningful alterations. Third, traditional industrial and export development zones showed relatively minor changes.
Meeyoung Cha, a data scientist in the team explained, "This is an important interdisciplinary effort to address global challenges like poverty. We plan to apply our AI algorithm to other international issues, such as monitoring carbon emissions, disaster damage detection, and the impact of climate change."
An economist on the research team, Jihee Kim, commented that this approach would enable detailed examinations of economic conditions in the developing world at a low cost, reducing data disparities between developed and developing nations. She further emphasized that this is most essential because many public policies require economic measurements to achieve their goals, whether they are for growth, equality, or sustainability.
The research team has made the source code publicly available via GitHub and plans to continue improving the technology, applying it to new satellite images updated annually. The results of this study, with Ph.D. candidate Donghyun Ahn at KAIST and Ph.D. candidate Jeasurk Yang at NUS as joint first authors, were published in Nature Communications under the title "A human-machine collaborative approach measures economic development using satellite imagery."

< Photos of the main authors. 1. Donghyun Ahn, PhD candidate at KAIST School of Computing 2. Jeasurk Yang, PhD candidate at the Department of Geography of National University of Singapore 3. Meeyoung Cha, Professor of KAIST School of Computing and CI at IBS 4. Jihee Kim, Professor of KAIST School of Business and Technology Management 5. Sangyoon Park, Professor of the Division of Social Science at Hong Kong University of Science and Technology 6. Hyunjoo Yang, Professor of the Department of Economics at Sogang University >